Teacher Demonstration
Use the live model as a shared screen demonstration before students try their own predictions and observations.
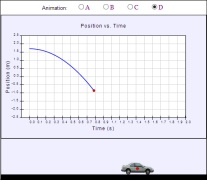
Analyse Problem 2 1 as a Tracker video-analysis activity for kinematics, using position-time and velocity-time evidence to reason about acceleration.
Use the live model as a shared screen demonstration before students try their own predictions and observations.
Open the simulation, adjust the controls, and compare what changes on screen before answering the concept-check questions.
How is velocity changing, and what evidence shows the acceleration?
Define the direction used for positive velocity and acceleration.
Observe how velocity changes over equal time intervals.
Use a velocity-time graph or numerical display to infer acceleration.
Decide whether acceleration is in the same or opposite direction as velocity.
Use this to separate the everyday word acceleration from the physics idea of velocity change. Students should look for change in velocity, not simply high speed.
Ask: Can an object be moving fast with zero acceleration? Can acceleration be negative while the object still moves forward? What does a steeper velocity-time slope mean?
Use paired cases: constant velocity versus increasing velocity, then increasing velocity versus decreasing velocity.
These questions are generated from the topic and the concept illustrated by the simulation. Use them after students have explored the model.
Correct first attempts build a streak and unlock higher point multipliers on this device.
1. What is acceleration?
2. What does a steeper velocity-time slope mean?
3. Can an object move with constant speed and zero acceleration?
4. What can negative acceleration mean?
5. What evidence identifies acceleration?
Unlocks after 3 correct concept-check answers on this page.
1. A car moves forward while its acceleration is negative. What is the best interpretation?
2. A velocity-time graph gets steeper but remains a straight line segment over a short interval. What does the steepness indicate?
3. Can an object have high speed and zero acceleration?
4. A bus speeds up from rest by equal velocity increases every second. What does that suggest?
5. What does acceleration in the same direction as velocity generally do?
Anonymous activity shows this resource is being discovered, revisited, and used by learners in different places.
Country or region is inferred anonymously from server location headers when available. No names, accounts, or IP addresses are shown.