Teacher Demonstration
Use the live model as a shared screen demonstration before students try their own predictions and observations.
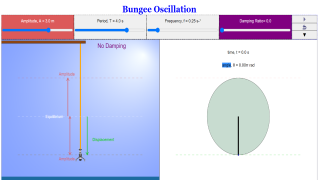
Explore Mass And Spring as an interactive EJS simulation for mechanics.
Use the live model as a shared screen demonstration before students try their own predictions and observations.
Open the simulation, adjust the controls, and compare what changes on screen before answering the concept-check questions.
How quickly does the amplitude shrink, and what does that say about energy transfer?
Mark several maxima or minima in the motion or graph.
Measure or estimate whether each peak is smaller than the previous one.
Explain that smaller amplitude means less mechanical energy remains in the oscillation.
Distinguish the restoring effect from damping or resistance.
Use this as a graph-evidence lesson: damping should be argued from successive peaks, not from one frame.
Ask: Which peak is smaller? Does the period change? Where has mechanical energy gone?
Have students draw an envelope over the graph peaks and describe what it means.
These questions are generated from the topic and the concept illustrated by the simulation. Use them after students have explored the model.
Correct first attempts build a streak and unlock higher point multipliers on this device.
1. What visible evidence indicates damping?
2. What happens to mechanical energy in damping?
3. Why compare successive peaks?
4. Does damping mean the restoring force is absent?
5. What is a strong damping conclusion?
Unlocks after 3 correct concept-check answers on this page.
1. In a bungee SHM interactive, what should students inspect at the lowest turning point?
2. What energy transfer is visible in a bungee oscillation model?
3. What fair comparison tests the cord or spring stiffness effect?
4. What feedback fits 'bungee motion is just free fall all the way down'?
5. What makes a bungee SHM answer expert-level?
Anonymous activity shows this resource is being discovered, revisited, and used by learners in different places.
Country or region is inferred anonymously from server location headers when available. No names, accounts, or IP addresses are shown.